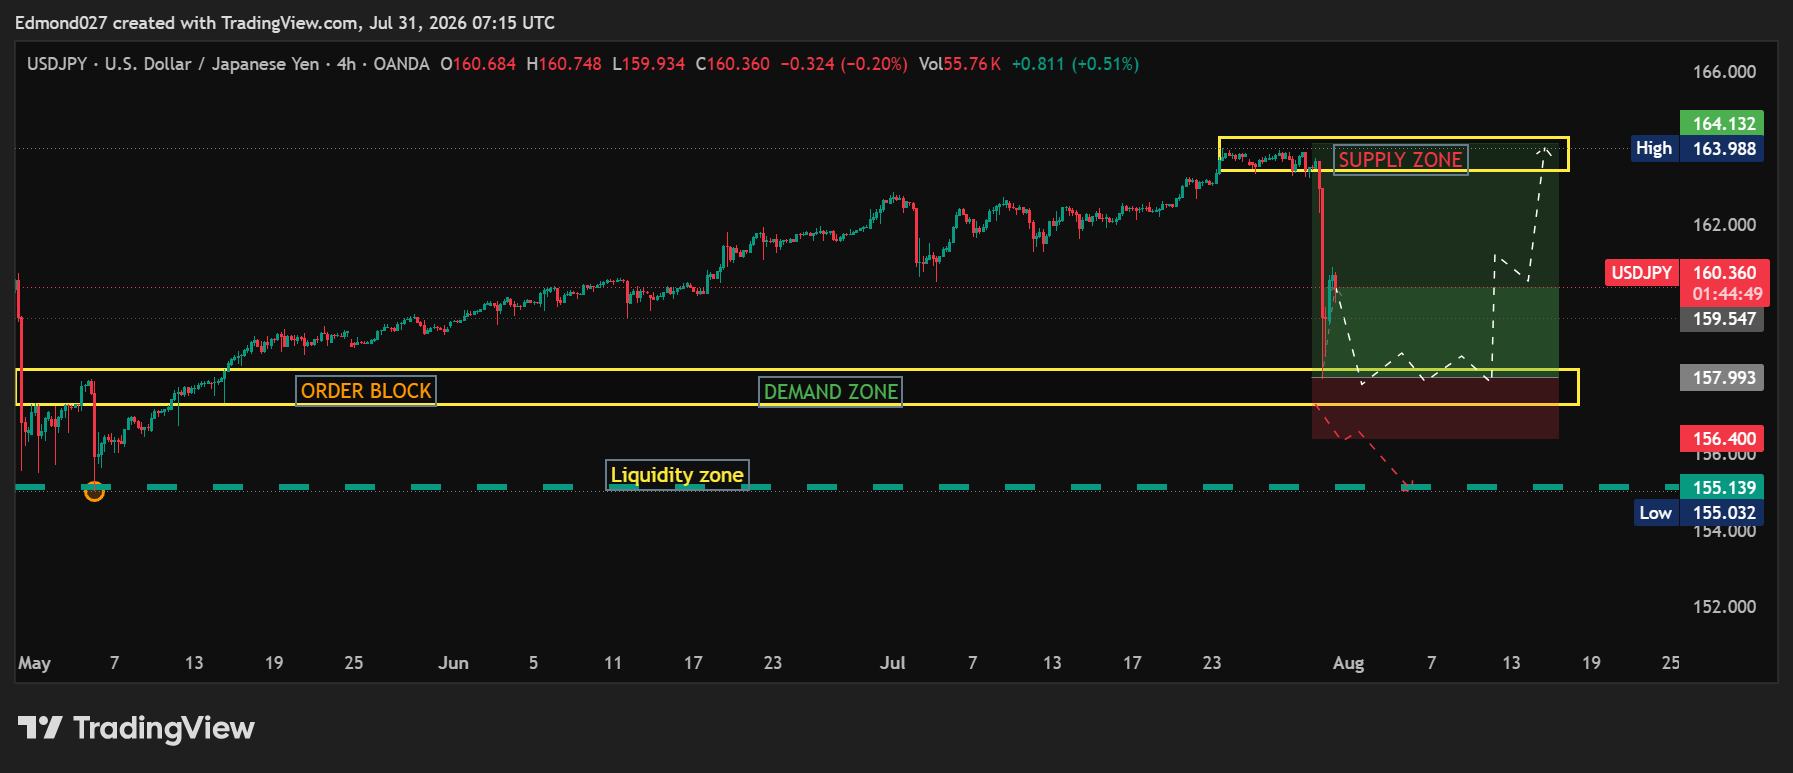
USDJPY H4 Technical Analysis 
Market Structure: The overall trend remains bullish, but price has experienced a sharp sell-off after rejecting the higher-timeframe supply zone. The current move is approaching a key demand area where buyers may step in.
 Key Levels to Watch
 Supply Zone:163.60 – 164.20
Major resistance where sellers previously entered the market.
A confirmed break and close above this zone could trigger a continuation toward new highs.
 Demand Zone / Order Block:157.80 – 158.10
Strong institutional demand area.
*This is the primary zone to watch for bullish confirmation and potential reversal setups.
 Liquidity Zone:Around 155.10
Equal lows/liquidity resting below the current demand.
If the demand zone fails, price could sweep this liquidity before finding stronger buying interest.
 Trading Scenarios
 Bullish Scenario
Wait for bullish confirmation (market structure shift, bullish engulfing, or strong rejection) within the 157.80–158.10 demand zone.
Initial targets:
TP1: 160.30
TP2: 162.50
PP3: 163.60–164.20 (Supply Zone)
 Bearish Scenario**
A decisive H4 close below 157.80 would invalidate the bullish setup.
The next likely objective becomes the liquidity pool around 155.10.
 Patience is key. Let price react at the demand zone before entering. Avoid predicting the reversal—wait for confirmation.
This analysis is for educational purposes only and is not financial advice. Always manage your risk.